





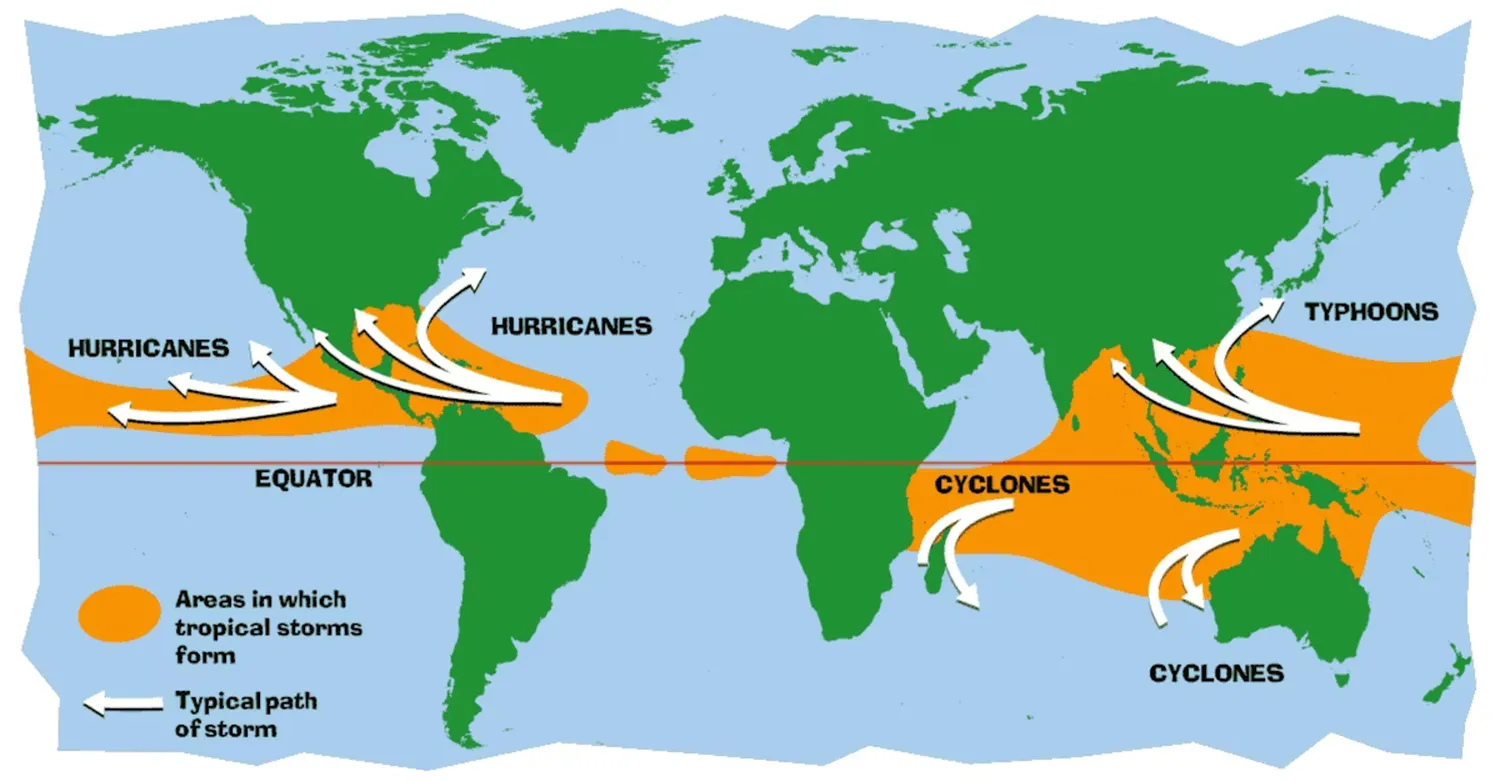
Learning how to track the movement of a hurricane on a map is a critical skill for coastal safety, emergency preparedness, and meteorological awareness. By interpreting structured mapping data, anyone can trace severe weather pathways across the ocean. Much like learning how to predict rain by looking at cloud formations before a standard storm breaks, tracking a tropical cyclone requires a systematic approach to reading atmospheric signals and official coordinates lines.
Understanding the Hurricane Tracking Grid
To accurately map out severe atmospheric disruptions, you must familiarize yourself with a coordinate charting map. Tracking maps are split into geometric grids demarcated by degrees of **Latitude** and **Longitude**. Latitude lines run horizontally, measuring distance North or South of the equator. Longitude lines slice vertically, displaying distance East or West of the Prime Meridian lines.
When tracking marine weather changes, tracking data often relates to other natural variations, such as identifying shifts in barometric parameters. For instance, just as knowing how to read a barometer to predict weather changes helps locate local atmospheric drops, tracking maps allow you to follow macro-scale systems over large bodies of water.
Step-by-Step: Plotting Storm Coordinates
Plotting the direct pathway of a tropical storm or hurricane requires consistent data updates, usually released every six hours by specialized entities like the National Hurricane Center (NHC). Follow this linear methodology to chart coordinates successfully:
- Collect Coordinates: Retrieve the latest advisory packet numbers (e.g., Latitude 24.5° N, Longitude 78.2° W).
- Find the Latitude: Trace along the vertical edge of the map to spot the specified degrees North of the equator line.
- Find the Longitude: Trace across the horizontal boundaries of the map to identify the coordinate degrees West.
- Mark the Center Points: Run your fingers along both lines until they cross. Draw a bold symbol or point on this exact junction point.
- Connect the Path: Draw a solid line from the previous location point to the new plot point to view the true moving heading.
If you enjoy setting up hands-on tools to gauge elements at home, like building systems shown in our tutorial on how to make a DIY rain gauge for school projects, maintaining a physical paper hurricane tracking map is an excellent real-world tracking practice.
Decoding the Cone of Uncertainty
A frequent error when analyzing a hurricane map layout is misinterpreting the forecast path projection, universally known as the **Cone of Uncertainty**. The cone illustrates the probable pathway area of the storm's center eye over a 3 to 5-day span. It does not reflect the total structural size of the hurricane clouds or the geographical span of rain bands.
| Forecast Element | True Interpretation |
|---|---|
| Cone Width | Indicates historical tracking margin error, widening as time goes on. |
| Center Line | The predicted average track, though deviations occur frequently. |
| Outer Edges | Severe weather impacts often extend hundreds of miles beyond these limits. |
While monitoring wind speeds and tracks, note that local squalls can bring massive cloud build-ups. Learning how to identify different types of storm clouds can warn you of incoming storm walls well before the outer eye bands reach your exact grid coordinates.
Critical Meteorological Metrics to Monitor
When studying how to track the movement of a hurricane on a map, tracking the coordinates path is only half the battle. You must monitor three primary supporting metrics alongside the graphical lines:
- Central Pressure: Measured in millibars (mb). A falling pressure metric indicates strengthening wind patterns.
- Forward Speed: The speed at which the entire system travels across map zones. Slow-moving hurricanes cause prolonged precipitation events.
- Maximum Sustained Winds: Dictates the categorical level of the cyclone via the Saffir-Simpson Scale.
Understanding these variables helps contextualize how severe storms shift ocean environments. Severe hurricanes derive their intense power from warm oceanic thermal dynamics, a process closely linked to broader global atmospheric trends like the changing global dynamics highlighted in our overview on how to explain the greenhouse effect to a child.
Frequently Asked Questions
How often are hurricane tracking maps updated?
Official advisory details and graphic charts are refreshed every 6 hours by meteorological agencies, typically at 5:00 AM, 11:00 AM, 5:00 PM, and 11:00 PM EDT. Intermediate briefs are supplied if major path modifications materialize.
Does the cone of uncertainty display where damage will occur?
No. The cone solely maps the probable trajectory path of the eye center. Hazardous storm conditions, dangerous storm surges, and destructive flash flooding frequently occur way outside the borders of the visible cone graphic.
What is the difference between a watch and a warning on a map?
A Watch indicates that storm hazards are possible within a specified zone inside 48 hours. A Warning states that destructive winds or storm surges are actively expected within 36 hours, meaning defensive actions must begin immediately.
Conclusion: Staying Safe Through Smart Mapping Awareness
Mastering how to track the movement of a hurricane on a map transforms complex marine data feeds into clear, actionable safety insights. By plotting daily coordinates, monitoring barometric pressure trends, and properly contextualizing forecast projection boundaries, you can accurately track changing weather patterns. Keep your tracking tools handy, update your charts regularly during active seasons, and lean on official meteorological advisories to safeguard your home and family.